The carbon footprint of technologies is the greenhouse gas emissions from making, powering and disposing of a device or service, usually counted in tonnes of CO2 equivalent. For most digital technology, the electricity source decides how large that footprint is.
The sections below follow the chain from measurement to cause to fix. For the wider comparison of energy sources, see our hub on fossil fuels vs renewable energy emissions.
How a carbon footprint is measured
A carbon footprint is shorthand for the amount of carbon emitted, usually in tonnes, for an activity or an organization. The same tonnes can also be converted into the area of productive land needed to absorb them, which is how the Global Footprint Network frames it. For technology, the tonne figure is the practical one, because it can be attached to a phone, a server or a cloud service.
A technology footprint is built in stages:
- Set the boundary. Decide whether you are counting one device, one service or a whole organization, and include production, use and disposal.
- Count the electricity. Record how much energy the product or service draws in kWh. Only about 20% of final energy consumption worldwide is electricity, so this step covers the electrified part of any footprint, according to World Nuclear Association data.
- Attach the grid’s intensity. Multiply the kWh by the emissions per kWh of the electricity that supplied it. Lifecycle studies express this as grams of CO2 equivalent per kWh, which is the common unit that lets different generation sources be compared.
- Add the supply chain. For many companies the majority of emissions lie outside their own operations, in what is called scope 3, as Net Zero Climate notes for the tech sector. A footprint that ignores purchased components understates the total.
The greenhouse gases being converted matter because concentration thresholds are set in CO2 equivalent. An atmospheric concentration of 450 ppm CO2 equivalent gives a 66% chance of meeting the 2°C goal in the IPCC’s 2014 assessment, and NOAA put the level at 523 ppm CO2 equivalent in 2022, as summarised by the Global Footprint Network. Any footprint you calculate is a small contribution to that total.
Where technology emissions come from
Digital technology is responsible for 1-2% of global emissions, according to Net Zero Climate. That share is modest in global terms, but it is concentrated in a few places that you can act on.
Devices and manufacturing
For mobile devices, lifetime emissions are mostly generated during production, the same source reports. The practical consequence is that keeping a phone in use for longer usually does more than saving a little charging energy. A replacement resets the production emissions, however efficient the new model is.
Data centres and networks
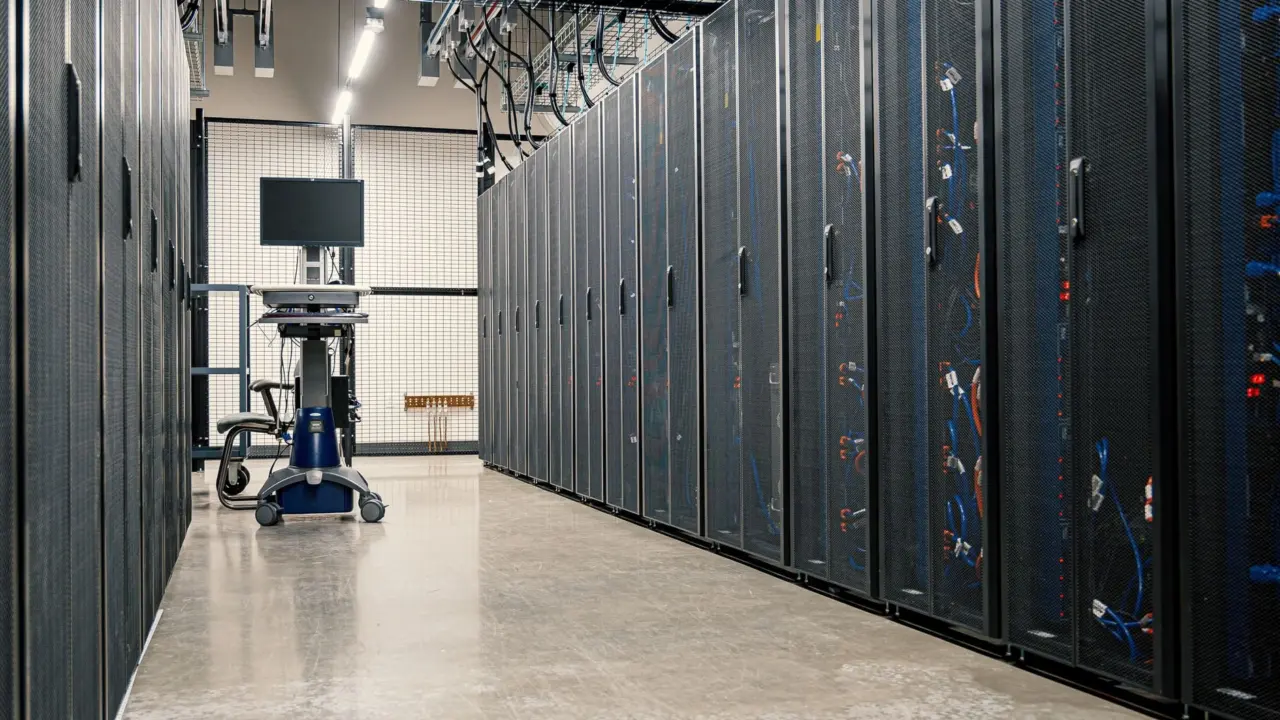
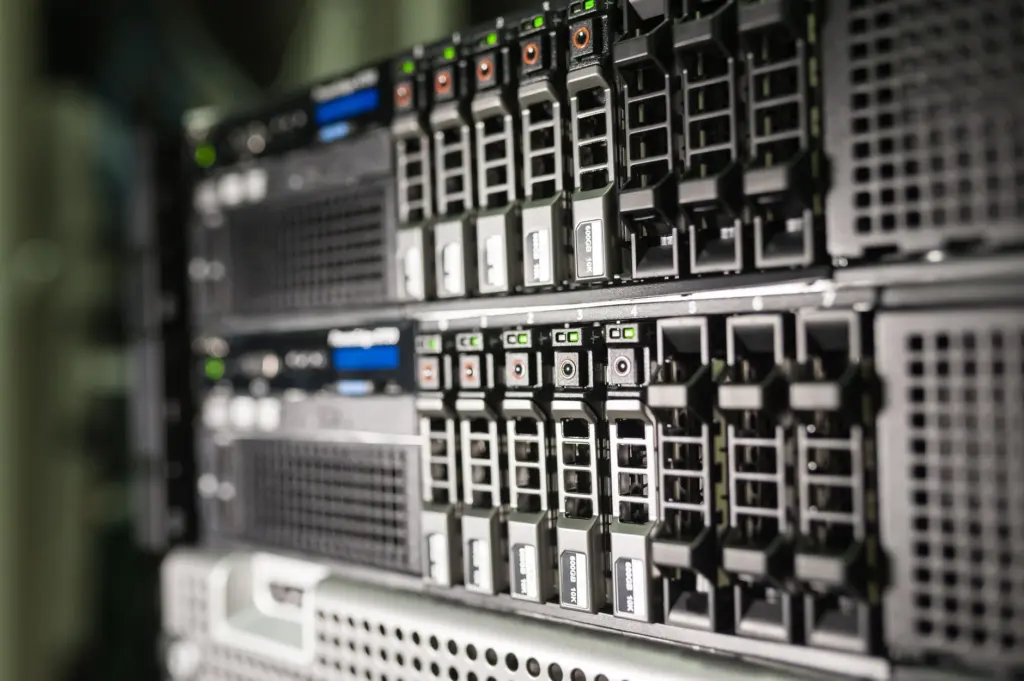
Data centre energy use has stayed flat at 1-2% of global electricity use, while hyperscale facilities can account for tens of percent of the national total in some cases, according to Net Zero Climate. A flat global share therefore hides large local effects. Where one facility is a major load on a regional grid, the choice of site and power supply matters far more than the global average suggests.
Supply chains and disposal
Because most emissions for many technology companies sit in scope 3, supplier data is the weak point in most footprints. For a buyer, asking suppliers for lifecycle figures is a more direct lever than offsetting after the fact. Disposal and recycling affect the footprint indirectly, since longer-lived and reused equipment reduces how much new hardware has to be produced.
Why the energy source decides the footprint
Data centre emissions are largely tied to the progress of local grid decarbonisation, Net Zero Climate states. Identical servers running identical software can have very different footprints depending on whether the local grid burns fossil fuels or draws on low-carbon generation.
The fossil fuel link
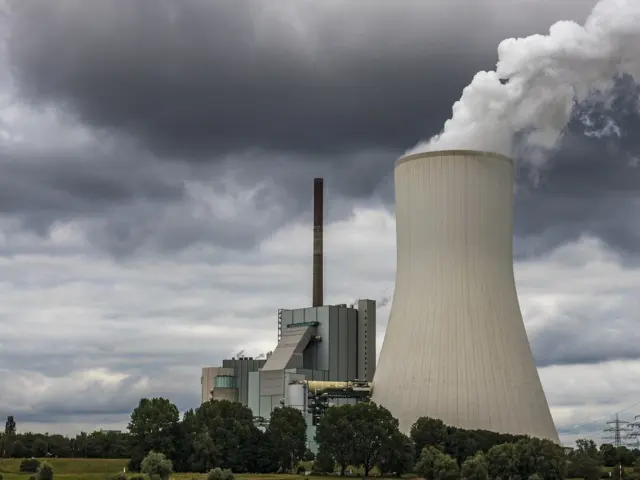
Burning fossil fuels for electricity generation accounts for over 40% of energy-related CO2 emissions, even though electricity is only 20% of final energy consumption, according to the World Nuclear Association. Energy-related CO2 from burning fossil fuels runs at about 37.8 billion tonnes per year, and over 50% more electricity is generated from fossil fuels than 20 years ago. Every kWh a server draws from such a grid carries that weight. Our guides on When Will We Run Out Of Fossil Fuels? A 2026 Reality Check And What It Means For You – Fixourfuel and How Are Fossil Fuels Created? A Clear, Up-to-Date Guide To How Dead Plants Became Oil, Gas, And Coal (2026) – Fixourfuel explain the fuels behind that generation.
Lifecycle emissions per kWh
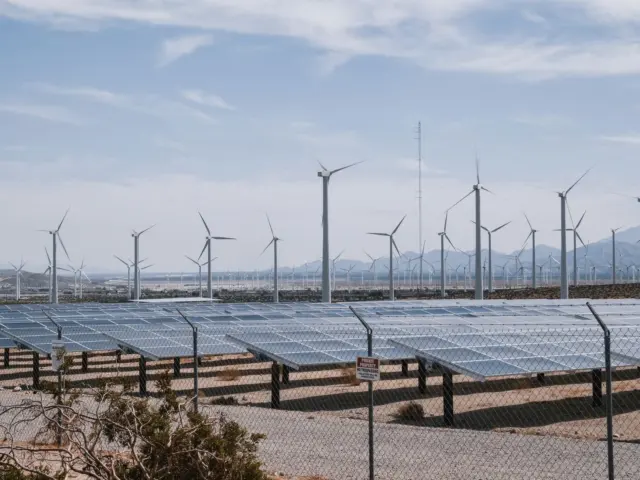
Lifecycle figures count construction, fuel supply and decommissioning, not just the moment of generation. For nuclear power, the IPCC’s median among peer-reviewed studies is 12 g CO2 equivalent per kWh, and a March 2022 UNECE estimate gives a range of 5.1-6.4 g CO2 equivalent per kWh. World Nuclear Association reporting puts nuclear at about the same lifecycle emissions per unit of electricity as wind and about one-third of solar. The practical reading is that low-carbon generation of several kinds is a different category from fossil generation. Choosing among them is usually decided by local availability and cost, not by a large gap in lifecycle carbon.
Cutting technology emissions: what works and for whom
The largest levers are on the supply side of electricity, with efficiency and behaviour behind them. In the IEA Net Zero Scenario, electrification and renewables are the two most significant mitigation measures, making up 54% of cumulative emissions reductions from 2021 to 2050, as set out by the LSE Grantham Research Institute.
| Lever | Share of cumulative reductions (IEA Net Zero Scenario) | Planning use |
|---|---|---|
| Renewables | 35% | Buy or site operations on clean supply first; this is the largest single lever. |
| Electrification | 19% | Pays off in step with grid decarbonisation, since electric equipment inherits the grid’s emissions. |
| Efficiency improvements | 13% (additional) | Cuts the kWh that need to be supplied; useful on any grid. |
| Carbon capture, utilisation and storage (CCUS) | 11% | A supporting option for fossil plants, not a substitute for clean supply. |
| Hydrogen | 6% | A smaller contributor; do not plan around it for typical digital equipment. |
These shares come from the IEA scenario as reported by the LSE Grantham Research Institute; they describe the global energy system, not any single company.
Steps for companies
- Clean the power first. Because data centre emissions track local grid progress, locate workloads on or contract for cleaner supply before chasing small efficiency gains.
- Measure supply chain emissions. With the majority of many companies’ emissions outside their own operations, supplier lifecycle data is the largest gap to close.
- Treat carbon capture as a trade-off. Adding CCS to a power station would increase the fuel needs of a power station by at least 25%, according to the IPCC’s 2005 assessment cited by the World Nuclear Association. It suits cases where fossil generation cannot yet be replaced.
Steps for individuals
Keep devices in service longer, since mobile device emissions are mostly generated in production. Beyond that, a large portion of the available emissions saving relies on the actions and behaviours of citizens and consumers, the LSE Grantham explainer notes. Where your electricity supplier offers a cleaner tariff, that choice has more effect than adjusting device settings.
Why the timeline matters
For a 1.5°C pathway, IPCC analysis says CO2 emissions need to reach net zero by the early 2050s, as the LSE Grantham explainer summarises. The Global Footprint Network adds context on scale: the carbon footprint is currently 60% of humanity’s overall Ecological Footprint and has increased 11-fold since 1961, and it calls reducing it the most essential step toward ending overshoot, in its climate change analysis. For technology, this means procurement and design decisions taken now lock in emissions for the life of the equipment.
Frequently asked questions
Do data centres use a large share of global electricity?
Data centre energy use has remained flat at 1-2% of global electricity use, though individual hyperscale sites can be a much larger share of a national total, according to Net Zero Climate.
Is nuclear power low-carbon over its whole lifecycle?
Yes. The IPCC median among peer-reviewed studies is 12 g CO2 equivalent per kWh, comparable to wind, as reported by the World Nuclear Association.
Can carbon capture make fossil-powered technology clean?
It reduces emissions at a cost. Capture raises a power station’s fuel needs by at least 25% and would likely double electricity prices, so it complements rather than replaces clean generation.
What is the net zero deadline for technology emissions?
The IPCC’s 1.5°C pathway requires CO2 net zero by the early 2050s, so equipment bought today is expected to operate on a far cleaner grid before it is retired, per the LSE Grantham Research Institute.