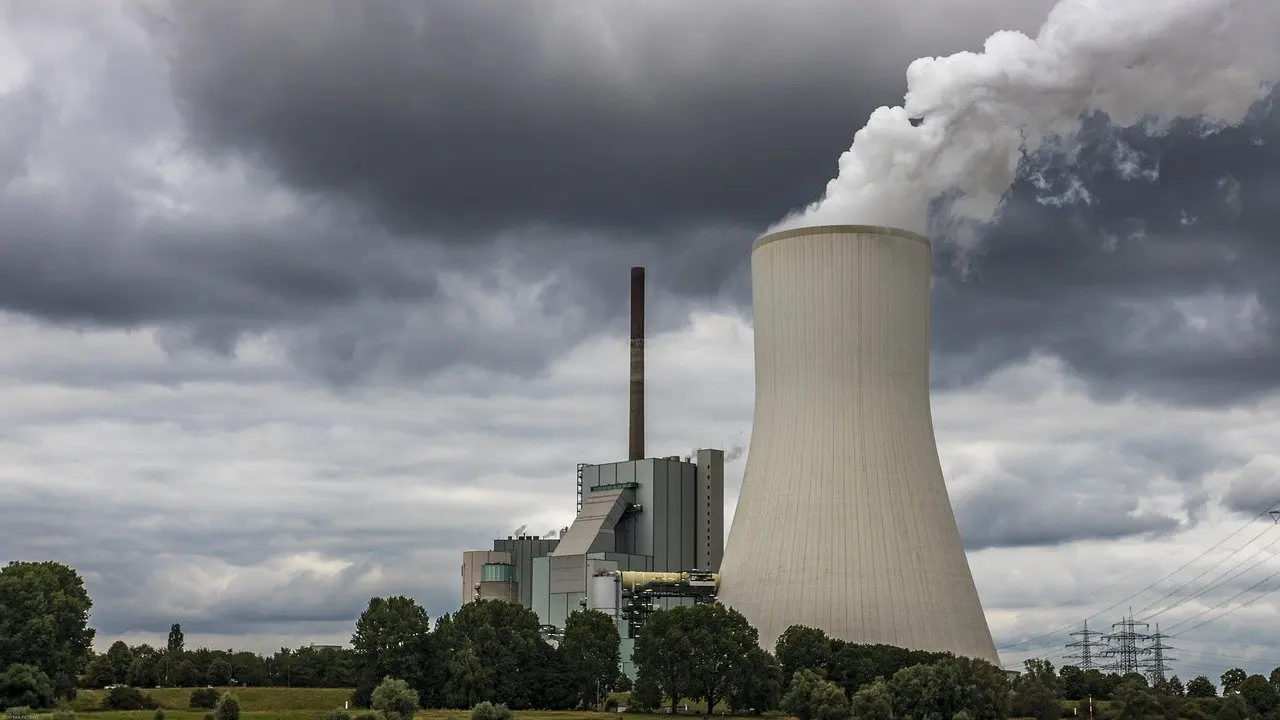
Fossil fuels vs renewable energy emissions is not a close contest: burning fossil fuels produces most of the greenhouse gases trapping heat, so shifting electricity and fuel use toward renewables is the most direct lever, provided it displaces fossil use.
Picture a household deciding on an electricity plan, a replacement car and a way to heat the home. Each decision sits on the same chain: fuel is burned, gases are released, heat is trapped and the air gets dirtier. This guide follows that chain using figures from the United Nations, Imperial College London’s Grantham Institute and Penn State, and shows where your choices change the result. For the physical mechanism behind the warming, see how do fossil fuels cause climate change.
Choose your route through the emissions question
The topic splits into five practical questions, and the right starting point depends on what you are trying to decide. Pick the route that matches your goal, then read the sections in the order given.
- You want to understand the cause. Start with where fossil fuel emissions come from, then read the comparison of fossil and renewable electricity.
- You are choosing between energy options. Go straight to the comparison table, then to what switching to clean energy actually saves. The second section matters because a cheaper or cleaner source does not automatically push fossil use down.
- You care about the air you breathe. Read the air pollution section, which separates health damage from climate damage.
- You want to know what targets mean. Read the targets and net zero section, which sets out the global timeline and the investment attached to it.
- You want to act at home. Finish with the section on putting the numbers to work, which turns the evidence into household decisions.
Where fossil fuel emissions come from
Burning fossil fuels is the dominant source of the greenhouse gases that warm the planet. The United Nations states that most of the greenhouse gases trapping heat in the atmosphere come from burning fossil fuels, mainly for electricity and heat.
The scale of the fossil contribution
A Penn State report, attributing the figures to the United Nations, puts the fossil fuel share at more than 75% of greenhouse gas emissions and almost 90% of carbon dioxide emissions (Penn State). The gap between those two percentages is informative. Carbon dioxide is the gas most tightly tied to fuel burning, while the remaining greenhouse gas emissions include sources beyond the fuel supply. That is why the carbon dioxide figure is the better guide when you are judging a fuel or electricity choice.
The power sector is where this is most concentrated. In 2023 it was the largest source of global greenhouse gas emissions, and fossil fuels still account for nearly 60% of electricity generation, according to the UN. For a household, electricity supply is therefore the first place to look. It is also the area where a switch of supplier or tariff changes the fuel behind your power without any change to how you live.
What burning releases
Carbon dioxide is only one part of the picture. Methane and nitrous oxide are also in play, and they behave differently in the atmosphere, which is the subject of what are the main greenhouse gases. Combustion also releases the pollutants that damage health, which are covered in the air pollution section below. For the chemistry of combustion and its consequences, What Happens When Fossil Fuels Are Burned: The Science, Pollution, And Consequences You Need To Know – Fixourfuel walks through it step by step.
Why the fuel stock does not renew
Coal and oil take millions of years to form, which is why researchers at Johns Hopkins SAIS do not consider them renewable. The practical consequence is that every unit burned is gone on any timescale that matters to a person or a policy. The origin of these fuels is explained in How Are Fossil Fuels Created? A Clear, Up-to-Date Guide To How Dead Plants Became Oil, Gas, And Coal (2026) – Fixourfuel. Whether supply runs short is a separate matter from emissions, and When Will We Run Out Of Fossil Fuels? A 2026 Reality Check And What It Means For You – Fixourfuel addresses it. Emissions are the binding constraint on fossil use long before depletion is.
Fossil fuels vs renewable energy: a side-by-side comparison
The comparison below uses growth in generating capacity and the cost of building new plants, because both show which way the electricity system is moving. Cost matters for emissions because a source that is cheaper to build is more likely to be built.
| Measure | Fossil fuels | Renewables | Planning use |
|---|---|---|---|
| Electricity capacity added, 2015 to 2024 | About 640 GW, an increase of 16% | About 2,600 GW, an increase of 140% | Shows where new build is going, while the fossil base remains large |
| Cost of new generation, Great Britain, 2023 | New gas without carbon capture: £124/MWh, including a £65/MWh carbon price | Wind £41/MWh; solar £48/MWh | A regional levelised-cost comparison for new plants, not a prediction for every country |
| Cost trend, Great Britain, 2012 to 2023 | Gas rose from £103/MWh to £124/MWh | Wind and solar fell to between £41/MWh and £48/MWh by 2023 | The carbon price is part of why gas costs more; the trend favours renewables |
| Global cost against fossil alternatives | Baseline for comparison | Solar 41% cheaper and offshore wind 53% cheaper; over 90% of new renewable projects cheaper | Supports choosing renewable tariffs or installations on cost grounds as well as carbon |
Capacity and global cost figures come from the United Nations, and the British levelised costs from the Grantham Institute at Imperial College London.
How to read the table
Levelised cost compares what electricity from a new plant costs over its life. It says nothing about emissions on its own, so read it as a reason that the cleaner option is increasingly also the cheaper one. In capacity terms, renewables added far more than fossil fuels over the period shown, yet fossil fuels still supply nearly 60% of electricity generation. New build is shifting faster than the existing fleet is retiring, so the emissions benefit builds up over time rather than arriving at once.
For a reader choosing between options, the cost evidence removes the old assumption that the low-carbon route carries a price penalty. The remaining choice is about fit: whether you can install generation, whether your supplier offers a renewable tariff, and whether the alternative to your current fuel is available locally. The wider case for and against fossil fuels, including the benefits that explain their continued use, is weighed in Fossil Fuels: Weighing The Pros And Cons In 2026 — What You Need To Know – Fixourfuel.
What switching to clean energy saves
Switching to clean energy saves carbon when the clean supply displaces fossil generation, and the evidence suggests that displacement should be pursued deliberately rather than assumed. The saving depends on what the clean source replaces, which is why a single per-household figure would mislead.
Carbon and the power sector
Because the power sector was the largest source of global greenhouse gas emissions in 2023, per the United Nations, cleaner electricity is the most direct route to a lower footprint. Fuel burned for heat and for transport adds to it. For a breakdown of what drives emissions across different technologies, The Carbon Footprint Of Technologies: What Drives Emissions And How To Cut Them In 2026 – Fixourfuel compares them. If your question is about petrol, how much co2 does a gallon of gasoline produce gives the per-unit figure.
Why new renewables do not automatically cut fossil use
Adding renewable capacity does not by itself reduce fossil fuel production. A Penn State study of 33 US states from 1997 to 2020 found no association between the production of renewable energy and of fossil fuels, and more than 96% of the variation in fossil fuel production across the states was explained by fixed factors. The author concluded that additional policies may be needed to help reduce the use of fossil fuels, as Penn State reports.
The study measures production in US states, not emissions, so treat it as a caution rather than a forecast. Its practical lesson for a reader is that a renewable purchase is strongest when paired with reduced fossil consumption, such as replacing a fossil heating or transport system rather than adding clean supply alongside it. It also explains why policy and individual choices work as a pair.
Health and climate savings
The United Nations says that reducing pollution and climate impacts could save the world up to $4.2 trillion per year by 2030 (UN). That is an upper bound on economic savings, not a carbon measurement and not a target for any one country. It is the figure to use when someone argues that clean energy is only a cost.
Clean technology has its own footprint in mining and manufacturing, and an honest comparison should include it. The trade-offs are set out in environmental impact of lithium mining, and the case of low-carbon nuclear power, with its waste and siting questions, is covered in is nuclear energy clean.
Fossil fuels and air pollution
Fossil fuels are the main source of the fine particulate matter and nitrogen dioxide that damage health. The United Nations says these pollutants originate mainly from the burning of fossil fuels, and that air pollution is associated with 7 million premature deaths every year.
The health and economic toll
The UN puts the economic health damage caused by air pollution at $8.1 trillion a year, equal to 6.1% of global GDP. Those figures link a household’s fuel to something beyond climate. Burning less fossil fuel cuts the pollutants that cause local harm, and that benefit arrives as soon as the burning stops, whereas the climate benefit builds across the whole atmosphere over time.
Climate and air quality are separate gains
This distinction should influence what you choose. A switch that reduces carbon dioxide but leaves local combustion in place, such as a stove in a living area, delivers less on air quality than one that removes the combustion. Wood is a good example because its climate and smoke questions pull in different directions, and is burning wood bad for the environment explains them. When health is your priority, favour options that remove the flame or exhaust from where people live and work.
Targets and net zero dates
The global timeline is clear even where national details differ: according to the United Nations, emissions must be reduced by almost half by 2030 and reach net-zero by 2050.
What net zero means
Net zero means that the greenhouse gases still emitted are balanced by what is removed, so the net total reaches zero rather than every source ending. The word “net” matters because it counts emissions and removals together, which is why the quality of removals and offsets is a separate debate. A fuller treatment is in what does net zero mean, and if you are tempted by credits to cover your own remaining emissions, do carbon offsets work sets out what to check before you buy.
The investment attached to the date
The UN also states that about $4.5 trillion a year needs to be invested in renewable energy until 2030 to reach net zero by 2050. This is a global figure for the whole renewable sector, so it should not be read as a cost to any one household. It does show that the target is a build-out programme, not just a pledge to emit less.
Using national pledges
National pledges differ in year and scope, so check the published target of your own government before relying on any figure quoted for another country. The global timeline gives a yardstick against which to judge whether a national date and its interim steps are ambitious. When a pledge has a distant date and no near-term milestone, treat it with caution, since the global reduction needed by 2030 leaves little room for late action.
Putting the numbers to work at home
The most useful household moves are those that cut fossil fuel burned, not those that merely add clean supply or cosmetic offsets. The evidence above points to an order of priority.
- Start with electricity. Power is the largest emitting sector and fossil fuels still supply nearly 60% of generation, so a renewable tariff or on-site generation addresses the biggest block. Cost evidence suggests this need not be a sacrifice.
- Replace fuel burning, not just fuel type. Where an electric alternative is available for heat or transport, it removes both the carbon and the local pollutants. For the vehicle question in particular, Are Electric Cars Better for the Environment? What the Evidence Shows in 2026 – Fixourfuel looks at lifecycle evidence.
- Measure your own footprint first. A rough sense of your largest sources prevents effort going to small items. Your Carbon Footprint: How Much Carbon Does One Person Produce (And Practical Ways To Cut It in 2026) – Fixourfuel gives a framework for doing so.
- Treat offsets as a last step. Cutting burned fuel reduces emissions directly, while offsets depend on how credible the credit is.
One decision rule covers most cases: if an option removes combustion you currently rely on, it usually delivers on carbon and air quality together. If it only adds a clean source next to continued burning, expect a smaller benefit, as the Penn State study of production suggests. Wait before acting only when the alternative is unavailable or unreliable where you live, and in that case start with the electricity tariff, which usually needs no equipment.
Frequently asked questions
| Question | Answer |
|---|---|
| What share of the world breathes air above quality limits? | About 99% of people in the world breathe air that exceeds air quality limits, according to the United Nations, which cites the World Health Organization. |
| Did emissions keep pace with the economy in 2024? | No. Energy-related carbon dioxide emissions growth slowed to 0.8% in 2024 while the global economy expanded by more than 3%, as the UN reports. |
| How much is spent on fossil fuels worldwide? | About $7 trillion was spent on fossil fuels in 2022, a figure that includes subsidies and unpriced damages, per the United Nations. |
| How much of the world’s electricity could be renewable? | The International Renewable Energy Agency estimates that 90% of the world’s electricity can and should come from renewable energy by 2050, as cited by the UN. |